
Compare Lease Options Like a Pro With This Lease Cost Calculator for Breweries
✅ Sample Version (no sign-up required)
Compare 3 lease options side-by-side
Calculates total occupancy cost (rent + NNN)
Calculates occupancy cost as a % of brewery revenue
Calculates effective rent per square foot per year
Benchmarks lease rate vs market comps
Clean dashboard view with summary KPIs
Use in Google Sheets or Excel
Made specifically for craft breweries and taproom operators

🔒 Get the Full Version (free with newsletter sign-up)
Everything in the Sample Version, plus:
Graphed year-by-year breakdown
Flags occupancy % of revenue over industry benchmark (e.g., 10%)
Built-in conditional formatting highlights key differences across lease options
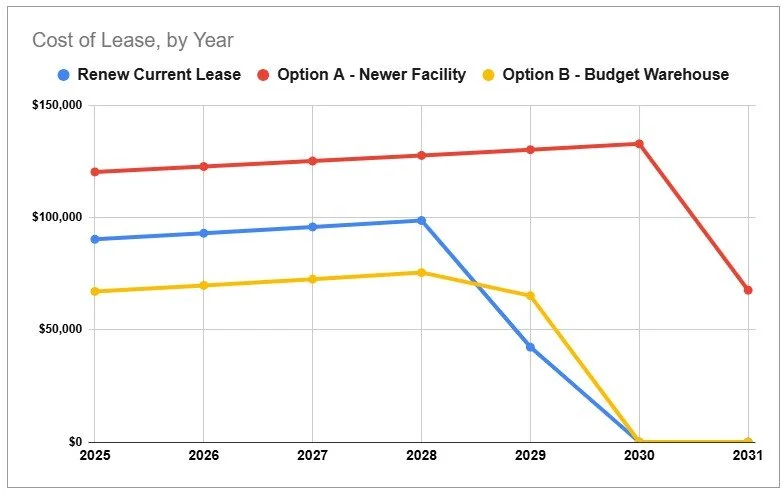
Forecasts and graphs cost of lease by year
Visual comparison chart of occupancy cost % of revenue
Tracks rent escalation over time due to compounding

Make smarter lease decisions with this worksheet designed to break down rent, triple-net (NNN) charges, and rent escalation costs across three different lease options.
Who is this brewery lease cost analyzer worksheet for?
This tool is built for brewery owner-operators, general managers, and anyone responsible for signing or renewing a lease for a beer production facility and/or taproom. If your existing lease is about up and you need to start analyzing and negotiating this spreadsheet can help.
What will this brewery lease cost analyzer worksheet help with?
This worksheet helps you compare up to three lease options, side-by-side, based on the components of your overall occupancy cost as a percentage of revenue. It’s designed to prevent you from locking into a lease that your brewery will regret.
When should you use this brewery lease cost analyzer worksheet?
Use it before you renew your existing lease, sign a lease for a new/additional location, or negotiate better terms for your current space. It will be especially helpful if you're facing a rent hike or considering a move and want a clearer picture of the long-term impact.
Where should you gather info from?
You’ll need:
Your existing lease documentation
Itemized rent and NNN charges from the landlord or broker
Your current square footage and the square footage of prospective sites
Your brewery’s revenue from the past 12 months
Local commercial rent benchmarks (not completely necessary, but useful for context)
Why use this brewery lease cost analyzer worksheet?
Leases are one of the “big three” expenses for breweries - right behind labor and cost of goods. Furthermore, they are fixed in nature, unlike the other two expenses. This tool helps you avoid buyer’s regret down the road by showing exactly how each lease option will escalate over time. You'll be able to:
Spot hidden future risks in lease renewals
Compare true cost per square foot against market benchmarks and other lease options
Know if your occupancy cost is too high relative to revenue
Make negotiation requests based on data, not hunches
How to use this brewery lease cost analyzer worksheet (step-by-step)
1) Start in the Lease Comparison tab
Enter the details for up to three properties:
Property Names
Property Addresses
Square Footage for each option
Lease Types
Triple-Net (NNN)
Modified Gross
Full-Service (Gross)
Miscellaneous/Other
Lease Start and End dates
Monthly Base Rent
Annual Rent Escalation (%)
Annual NNN charges
Notes about tenant improvements offered and whether subletting or subleasing is allowed
2) Enter your Current Annual Revenue
This amount is used to calculate your Occupancy Cost % of Revenue, a key metric for lease analysis. You can also use a conservative estimate of future revenue.
3) Check the automatically calculated metrics
You’ll see:
First Year Occupancy Cost (base rent & NNN charges)
Occupancy Cost % of Revenue (flagged if it exceeds 10%)
Effective rent per square foot
Rent vs Market (%)
4) Use the chart to visualize how each lease’s cost changes over time
The color-coded line chart helps you quickly spot which lease starts low but becomes expensive later—and which one stays stable. This is especially useful for forecasting and understanding the long-term cash flow impact.
5) Use these insights to negotiate the best lease for your brewery
If one lease has steep escalation or unfavorable clauses, you’ll be equipped to ask for more beneficial terms.