Pay Attention to Your Taproom Data, Not What You Read Online
Retail data that you find in trade magazines or industry reports is built on averages. And while averages can provide context, they don’t tell the full story of your brewery’s performance - especially your taproom. Those numbers can be skewed, and they certainly don’t reflect what’s happening in the trenches of your business. National statistics are just the middle of the bell curve, with some breweries doing incredibly well and others struggling. But your taproom’s performance isn’t an average—it's your reality.
And here’s the thing: there’s nothing you can do about national or regional brewery data. It’s completely out of your control. But what is in your control is everything happening in your taproom. You can make decisions right now that directly impact your taproom’s performance. That’s why you want to rely on your own data — your sales, your tickets, your member activity—to guide your strategy. Sure, stay informed about the industry, but don’t let national retail data set the course for your brewery.
Rethink where your brewery’s growth will come from
National retail data doesn’t reflect what’s happening at the local level. The U.S. is a patchwork of unique regions and metropolitan areas. While one area might be struggling, another could be thriving. Don’t let macro-level reports about the beer industry cloud your judgment about what’s happening in your taproom.
There’s something called Stockholm Data Syndrome, which is a term used to describe breweries that over-rely on broad industry data. Data that may not even apply to their situation. Sure, it’s important to know where the national market is trending, but that’s not where your strongest customers are coming from. The truth is, your best customers are likely the ones who walk through your doors, not the ones buying off a shelf at a far-away grocery store.
Before making big strategic decisions, reference your own point-of-sale (POS) data instead of just leaning on industry-wide reports from Nielsen or Circana.
Troegs independent brewing serves as a good example. They focus on direct customer sales over wholesaling. Troggs invested heavily in their on-site experience and their tap room. Also when things like tastings led by knowledgeable staff and brewery tours. They also focused on exclusive beer releases that are only released on-site further incentivizing loyal customers to come to their tap room. This drives customer loyalty and revenue by focusing on the customer experience not just volume. Rather than fighting for shelf space on then margins they decided to make their tap room the center of attention.
Build your own picture with your brewery’s metrics
Your POS system is more than just a glorified cash register—it’s a data goldmine. It should be tracking:
Total tickets sold each month
Average revenue per ticket
Rewards usage and redemptions
These metrics are critical because they give you a clear understanding of your taproom’s real performance — not just how much beer you’re moving, but how many times people are coming back and how much they’re spending. It’s your own internal benchmark that tells you more about your brewery’s health than any national average.
And unlike regional or national data, you can access this information in real-time. Waiting for quarterly reports or gut feelings isn’t good enough. You should be reviewing this data monthly, at the very least, to see if you’re trending up or slipping behind.
What should you specifically look at?
Total and per-ticket taproom revenue
Number of tickets sold (taproom traffic)
Rewards program tickets and redemptions
Tracking these consistently shows you:
What percentage of revenue is coming from your best customers
Whether your rewards program is driving repeat visits or just eating into margins
If your program is growing, stagnating, or cannibalizing regular sales
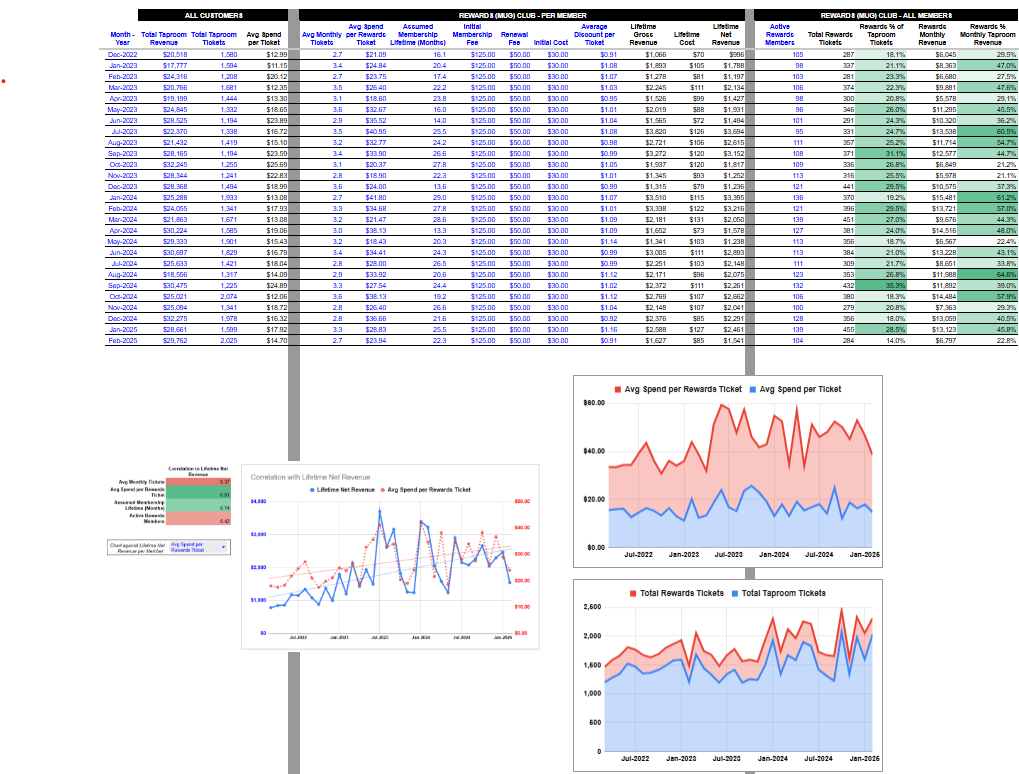
If you don’t track these metrics yet, it’s time to start. The Rewards ROI Calculator I created can help you easily compare rewards members to regular, casual customers.
It breaks down:
Average spend per ticket
Average monthly tickets per member
Lifetime gross revenue, lifetime cost, and lifetime net revenue
It even helps you identify which variables—like ticket volume, spend per ticket, or membership lifetime—are driving growth. You might be surprised by what’s actually moving the needle.
Get your team involved in data collection
Ideally, you should be the one reviewing this information. But if you’re stretched thin, consider delegating it to a trusted staff member like your taproom manager or lead bartender — someone who’s already in your POS system daily. Most modern POS systems (like Toast, Arryved, Square, or Clover) can easily export ticket and sales reports by date range and customer type.
Action Steps:
Schedule a recurring task on the first business day of each month to pull the data
Set aside 15–30 minutes per month for this process
Store it in a shared Google Sheet or email summary that you and your accountant can access
Review the numbers against the Rewards ROI Calculator for a quick sense of where your taproom is winning and where it’s lagging
A little bit of diligence each month goes a long way in understanding your true customer behavior.
Trust your taproom more than the trends
National data on the brewery industry has its place—it gives you context and a sense of the broader market. But it should never replace the hard data sitting right inside your POS system. That’s where your real decisions should come from.
What’s happening in your taproom is the purest reflection of how your customers feel about your beer and your brand. It’s a mirror of your community’s support, their loyalty, and their habits. If you understand those metrics, you’re making decisions based on what matters—not just what’s happening in the news.


