Pricing Beer for Profit: How to Maximize Margins in Different Markets
Your beer’s price sensitivity will vary depending on where it’s distributed. You have to know the market—and what its tolerance is for higher-priced beers. Then, measure this against not only the cost of goods sold (COGS), but also the shipping cost to get it there. Does it make sense? How does it stack up against competitors? Can you get a healthy operating margin selling your beer in that region?
Lower prices will move faster and attract curious customers. Higher prices may slow movement unless the brand has built-in awareness or premium positioning. The goal is to find the right balance.
Calculating optimal beer pricing by region
Pricing is dynamic, subjective, and especially tricky for breweries. It’s not just about hitting a margin—it’s about how your price lands in different cities and markets. If you’re shipping across state lines, shipping cost becomes a major variable. It also affects reorder pace—i.e., your sales velocity.
Here’s a simple formula for setting price by region:
(COGS per bbl + Shipping per bbl) × (1 + Desired Margin %) = Target wholesale price per bbl
Example:
COGS: $90
Shipping to Midwest: $25
Target Margin: 35%
($90 + $25) × 1.35 = $155.25
That’s your starting price for that region. Now compare it with competitors. If a local Colorado brewery prices their comparable beer at $160–$170 wholesale, you’re in the right range. But if a Northeast brewery ships to the Midwest and charges $220+, you may have pricing power—but you’ll need to justify with brand recognition or product style.
You can build a table by region with:
Competitive wholesale prices
Notes on brand positioning, product style, or other edge factors
If your pricing ends up significantly higher than competitors, you’ll need to justify it—or reconsider targeting that market.
The sensitivity of small price changes
Even a $1 difference in price can affect your sales velocity. Let’s say you’re selling a beer at $155 with a 5 bbl per week velocity. At $156, you estimate velocity drops to 4.8; at $157, it drops to 4.5; and at $158, to 4.2. That’s a 2% price increase—but a 17% drop in volume.
These are rough estimates, but you can get realistic inputs from your distributor. It’s about understanding how your pricing affects their pricing—and ultimately the retail price.
Enter this into a spreadsheet and visualize your pricing elasticity. If this isn’t your thing, delegate it:
Have your bookkeeper or ops manager update monthly or quarterly
Hire a freelancer from Upwork ($25–$40/hour) to build a reusable template
The impact of shipping costs on beer margin
For small and midsize breweries, shipping costs can wreck operating margins. The farther your beer travels, the more risk you're taking. Logistics can quietly eat away at profits.
Shipping costs can be:
Flat-rate (e.g. $200 per pallet, regardless of volume)
Variable-rate (e.g. $25 per per bbl based on distance/volume)
Example table:
Flat rate: $200/pallet from Boston to Chicago → cost per bbl drops with larger shipments
10 bbl = $20 per bbl
25 bbl = $8 per bbl
15 bbl = $13.33 per bbl
Variable rate:
$20/bbl from Oregon to Arizona = stable per-unit cost
Easier to forecast and budget
Use this to decide shipment frequency and volume.
Adjusting prices to absorb shipping costs
Let’s say:
COGS: $90/bbl
Local shipping: $0 → Total cost = $90
Out-of-state shipping: $20 → Total cost = $110
Applying a 30% markup:
Local wholesale = $90 × 1.3 = $117
Out-of-state wholesale = $110 × 1.3 = $143
That’s a major jump. And once the distributor and retailer apply their own markups, the end consumer could see a big price delta. Will they pay it?
That’s where perceived value and price elasticity come in. Some urban markets may support $12 pints without blinking. Others—especially rural or budget-conscious markets—won’t.
How to protect your margins
Ship fuller pallets to spread flat-rate shipping over more bbl
Offer smaller formats (e.g., 1/6 bbl) to reduce spoilage and allow higher price per ounce
Partner with other breweries for shared loads
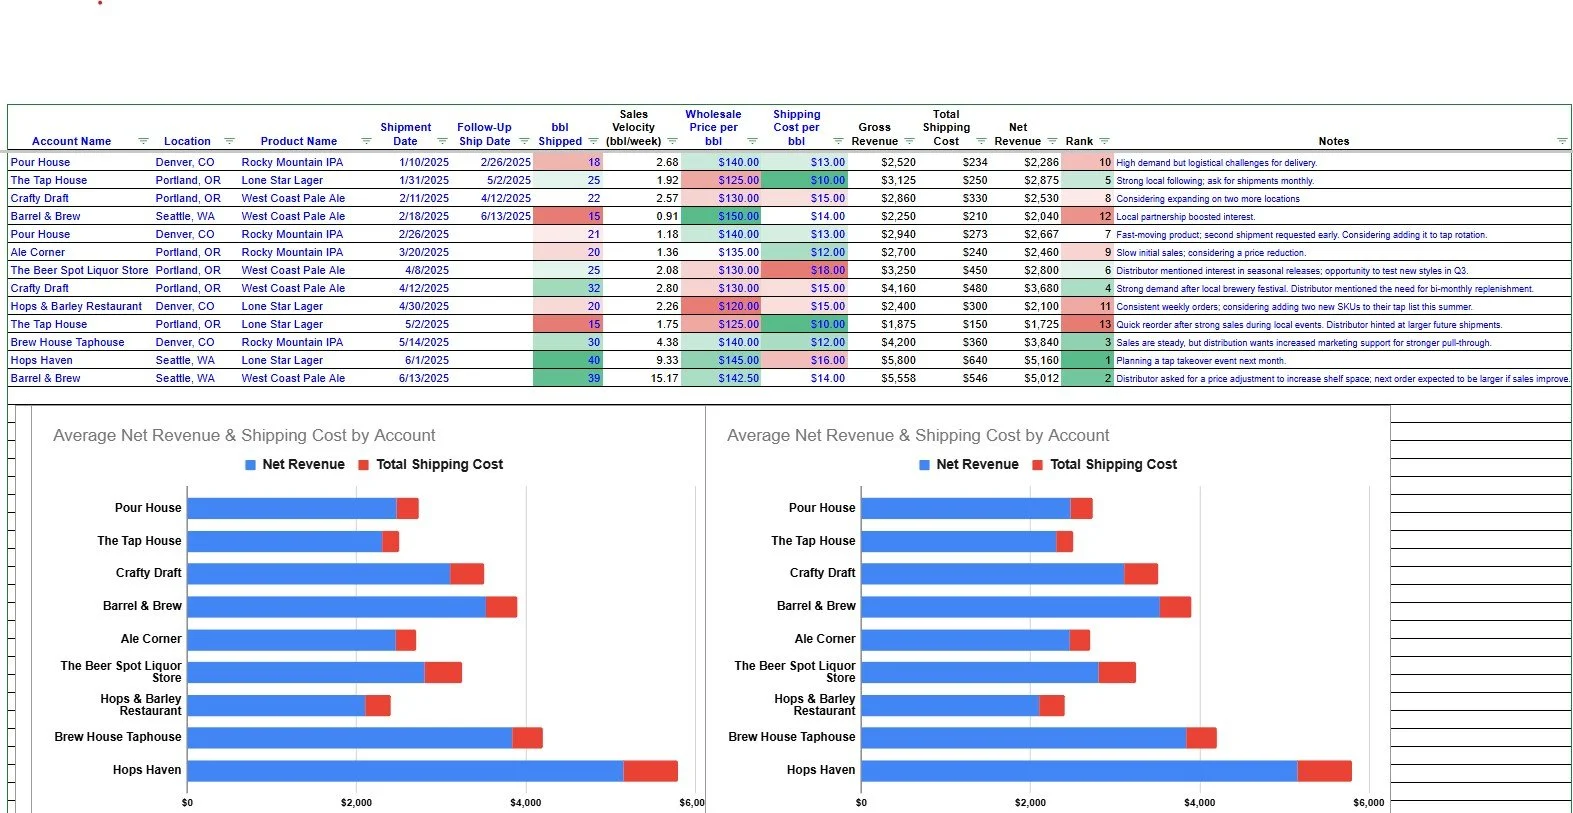
Use the Sales Velocity Tracker to plug in shipping costs per account. Compare:
Gross revenue vs. net revenue after shipping
High-margin accounts vs. ones where logistics kill profit
Spreadsheets like this help you:
Reevaluate low-performing placements
Spot high-margin, low-shipping cost accounts to prioritize
If you want to tighten this process, have your production or sales coordinator update shipping costs monthly. They’re already managing logistics. You can also use tools like:
ShipHawk – Logistics automation for SMBs
Freightview – Shipping rate comparison tool
Price your beer right and sell fast
Pricing isn’t just about covering costs or hitting a generic margin target. It’s about balancing healthy margins with fast sell-through.
Price too high? Your beer sits and collects dust. Price too low? You’re leaving money on the table.
The ideal price point lies somewhere in the middle: high enough to make you money, low enough to keep inventory moving and your beer visible.
You’ll probably never hit it exactly—but tracking your pricing, shipping, and velocity gets you close. And close is good enough to grow a profitable, sustainable brewery.


