Understanding Sales Velocity: How Fast is Your Beer Moving?
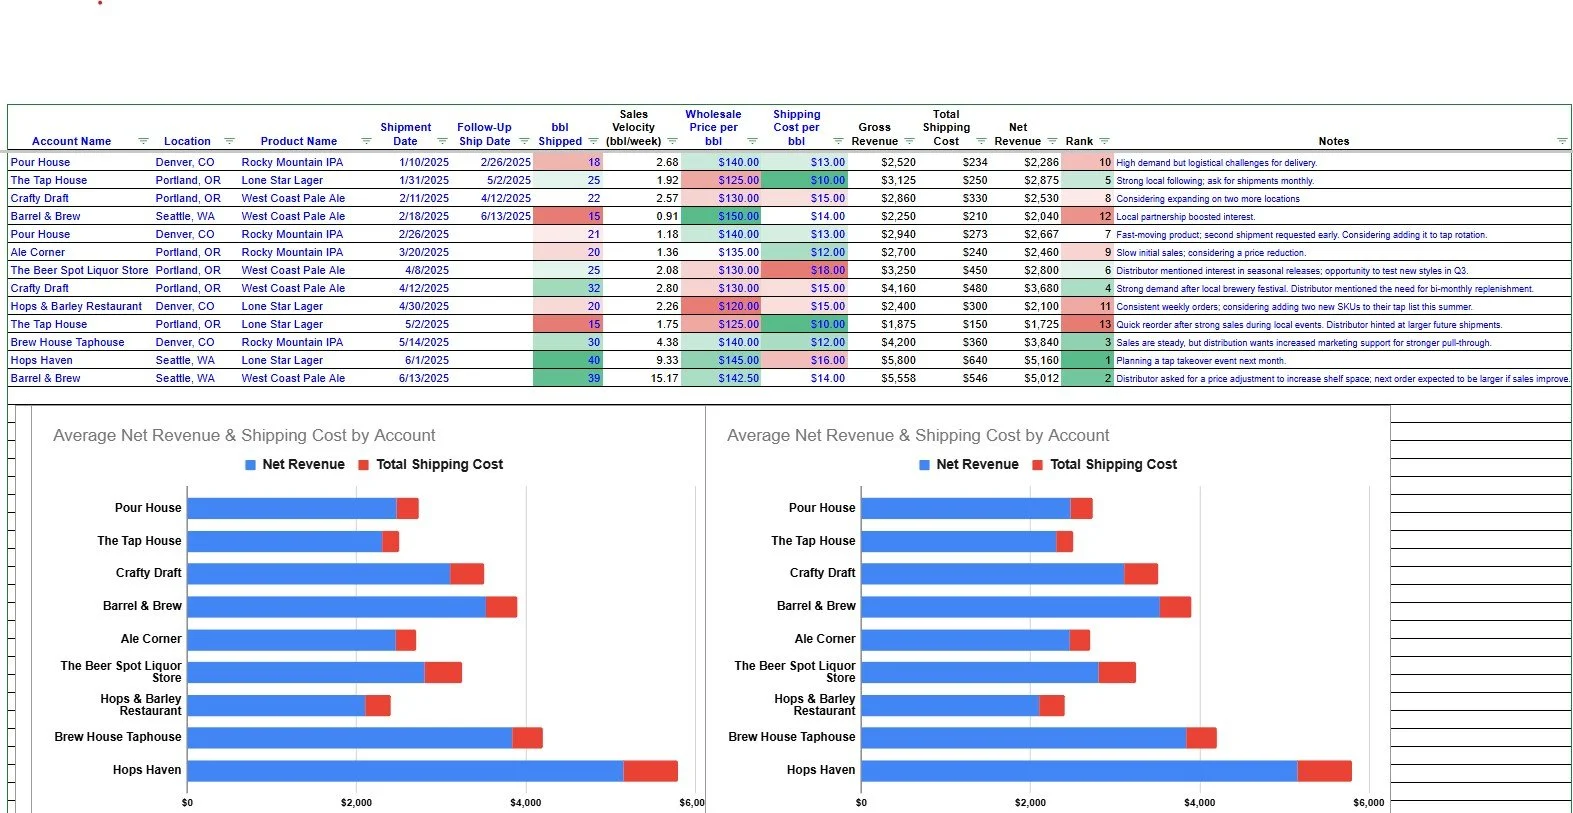
Sales velocity is a simple but powerful calculation that measures how fast your beer is selling in the retail channel. It’s simply the number of barrels (bbl) you’re shipping per week of a given beer to a given account. Tracking sales velocity helps you identify which account/product combos are top performers and which are dragging. It also gives you benchmarks to spot slow movers. Most importantly, consistently measuring sales velocity can improve your forecasting and give you a stronger footing when talking with your distributors.
Calculating your brewery’s wholesale sales velocity
Sales velocity is just a fancy way of saying: total bbl shipped divided by the number of weeks since the shipment. That gives you the average number of barrels you've moved per week. Higher numbers mean faster sell-through; lower numbers mean slower.
It’s a simple, essential metric that tells you not only how much you’re selling—but how consistently. It highlights which accounts and beers are overperforming or underperforming, and gives you a single number to focus on when making distribution or sales adjustments.
Example:
Let’s say you shipped 30 bbl of your flagship IPA to a distributor on April 1. It’s now May 13, and no follow-up shipment has been made.
Why mention follow-up shipments? Because once that next shipment happens, we assume the original batch has sold through. That “locks” the velocity number. Until then, the weeks continue to stack up—while the shipment size stays fixed—causing the velocity number to slowly drop.
Step-by-step:
Shipment Date: April 1
Today’s Date: May 13
Days Since Shipment: 42
Weeks Since Shipment: 42 / 7 = 6
Sales Velocity = 30 bbl / 6 weeks = 5 bbl per week
If another week goes by and there’s still no reorder, the formula becomes 30 bbl / 7 weeks = 4.3 bbl /week. Even if the product is moving, the metric keeps softening until it’s reset with a follow-up order.
Why track it consistently?
Running this calculation on an ongoing basis helps you:
Set realistic benchmarks for new and existing beers
Forecast inventory needs based on real sell-through numbers
Identify which flagships are gaining or losing steam
You might know a hazy IPA is healthy above 6 bbl per week but in trouble below 3. A stout might be strong at 3, but only a concern if it drops below 1. Context for everything.
Tracking this trendline helps you plan production, pricing, and placement. You can also analyze whether sales velocity is climbing or fading over time.
The tracker I built highlights key numbers automatically using conditional formatting.
Prioritize your winners, investigate your laggers
High-velocity account/product combos deserve attention: follow-ups, marketing support, and maybe exclusive drops.
Low-velocity ones could be overstocked, underpromoted, or just a bad fit.
Look for patterns: are similar products moving faster in other regions? Are there missed opportunities to expand based on strong comparables?
Using sales velocity to influence distributor reorders
Sales velocity isn’t just another KPI — it’s a conversation tool. When certain thresholds are met (or missed), it prompts action. Knowing how fast your beer is moving with a retail account helps you engage distributors about when and where the next shipment should land.
It’s also a way to avoid overstock at the retailer. Excess inventory, even if it’s not your fault, reflects poorly on your brand. Sales velocity helps you show up as a responsible, reliable brewery partner.
Use thresholds as internal triggers
You don’t make the reorder decisions, but you can absolutely influence it. Set velocity floors for each product:
Flagship IPA: 5 bbl per week
Rotating seasonal: 2–3 bbl per week
Niche stout: okay even under 1 bbl per week
If a product falls below your threshold:
Talk with your distributor: Is sell-through slow? Is the product mismatched for the account?
Pause future shipments: Avoid compounding the problem
Support the product: Adjust pricing, provide education, or run small marketing pushes
Velocity acts like a check engine light. It won’t tell you everything - but it’ll tell you when to look under the hood.
Quantify the cost of slow movement
Slow inventory hurts everyone. Brewer, distributor, retailer.
While a breakdown of the storage cost calculation is beyond of scope this post, you can estimate: Cost of Delay = (Storage Cost per Week + Missed Margin per Week) Weeks Delayed
Example:
Storage: $3 per week
Delayed: 4 weeks
Lost margin: $50 per week
Total drag = $53 × 4 = $212
What if velocity improves by 10%, 20%, or 30%?
Velocity = 5 bbl per week, Shipment = 30 bbl - Next reorder expected in 6 weeks
At 5.5 bbl per week - Next reorder expected in 5.4 weeks
At 6 bbl per week - Next reorder expected in 5 weeks
At 6.5 bbl per week - Next reorder expected in 4.6 weeks
Faster velocity means:
More frequent reorders
Stronger shelf presence
Better leverage for seasonal features or prime placements
Monitor, adjust, and succeed
Sales velocity isn’t just a number—it’s a strategic tool. Tracking it consistently helps you:
Spot trends early
Identify top-performing account/product combos
Protect your brand from slow-moving placements
When you use the Sales Velocity Tracker:
Log every account/product combo
Use Shipment Dates and Follow-Up Ship Dates to lock historical velocity
Look for patterns an set your benchmarks for each product type
Then use this data to drive better conversations with your distributor. Bring insights to the table. Highlight where velocity is strong, and suggest adjustments where it’s weak.
Your distributor might even have some of this data already. Use them as a resource to know what, where, and when your beer shipped (if you don’t already know). Compare what you’ve learned with what they know.
The end result? You’re not just another brewery on their list. You’re a strategic partner who helps them move more beer. And that’s how you win better placements and build longer-term, successful, relationships.


