
Experimental Beer Analysis to Compare Rebrew Potential
✅ Sample Version (no sign-up required)
Easy input fields for beer name, style, brew date, batch size, and batch costs
Automatically calculates total batch cost from ingredients, packaging, labor, and overhead
Tracks sales duration with start and end sell dates and calculates sell-through time in weeks
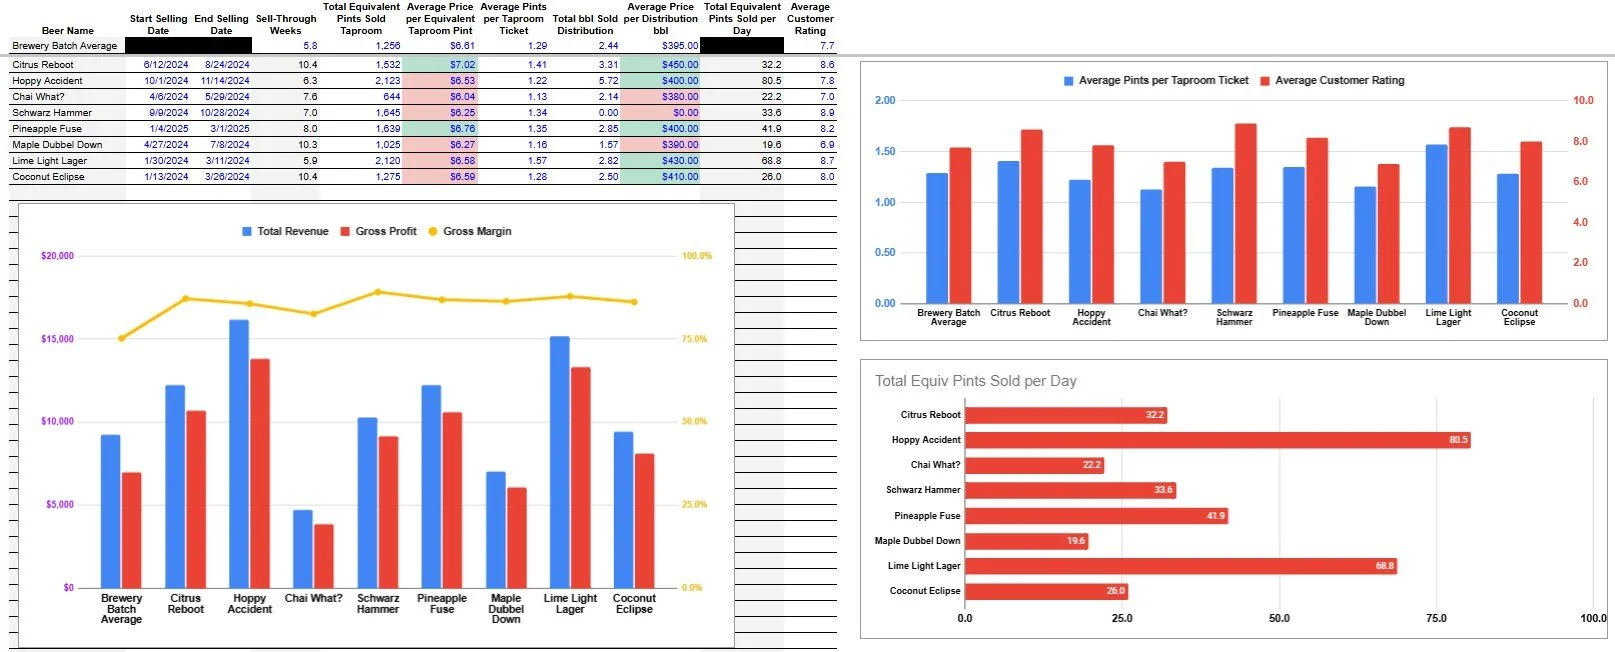
Captures unit mix: taproom pints sold, pints per ticket, distribution volume, and pricing
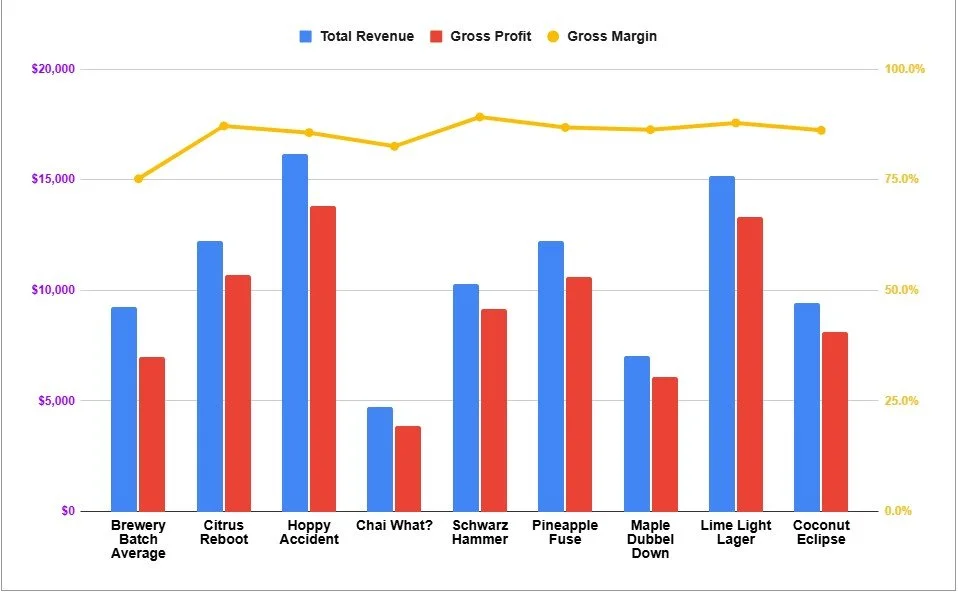
Automatically calculates total revenue, gross profit, and gross margin
Side-by-side comparisons across all experimental batches

🔒 Get the Full Version (free with newsletter sign-up)
Everything in the Sample Version, plus:
Color-coded conditional formatting to compare each beer to your brewery average
Highlights top and underperforming beers by margin, revenue, and pricing at a glance
Charts to visualize total revenue, gross margin, profit, pints per ticket, and more
Designed to guide better decisions on what to rebrew, tweak, or retire
This planning tool gives small craft breweries a way to evaluate the profitability and appeal of experimental beers by referencing cost, sales, and feedback data. The worksheet helps you track what’s working by measuring against a benchmark. Should you scale up on a seasonal hit or retire a one-batch wonder? This Experimental Beer Postmortem worksheet will give you confidence in your decision.
Who is this experimential beer worksheet for?
This worksheet was made for owner-operators, head brewers, general managers, and/or any other brewing decision-maker at small to midsize craft breweries.
What will this experimential beer worksheet help with?
It helps these individuals analyze the performance of one-off or experimental beers. From cost breakdowns to sell-through time to taproom feedback to profit margins. You’ll be able to tell which beers should be rebrewed and which ones should be laid to rest.
When should you use this experimential beer worksheet?
Use this worksheet after an experimental or limited-release beer has been sold through. Review it during planning meetings or when you are prepping for seasonal lineup updates.
Where can you find the data for this experimential beer worksheet?
Most of the inputs come directly from tools you already use every day:
Batch size, ingredient, packaging, and labor cost
Pulled from your brew logs, brewery management software, or inventory tracking software
Overhead allocation
Estimated from your monthly financials or calculated using my Cost Effective IPA calculator
Taproom pints sold, pricing, and ticket averages
From your POS system (Square, Arryved, Toast, and so on)
Distribution volumes and pricing
From invoices or your wholesale sales logs
Customer feedback
From tasting room staff notes, digital surveys, or informal taproom feedback
Even if you don’t have perfect information, close estimates should be good enough to spot patterns and identify your best experimental beers.
Why use this experimental beer worksheet?
Understand which limited-release beers can help your business
Spot trends in customer tastes
Make informed decisions about scaling, dropping, or tweaking recipes
Create internal benchmarks for future experimental brews
How to use this experimental beer worksheet (step-by-step)
This spreadsheet has three tabs:
Batch Overview
Sales & Unit Mix
Performance Metrics
Blue text indicates inputs. Black text is formulas.
Step 1 – Enter batch info in the Batch Overview tab
Type the beer name in column B
Type the beer style in column C
Enter the date the batch was completed in column D
Input the total batch size in barrels in column E
Enter your ingredient, packaging, labor, and allocated overhead costs in columns F:I
If you need help with this, check out our Cost Effective IPA worksheet
Add any staff notes or feedback (taste, foam issues, etc.) in column L
Step 2 – Fill in post-sale data in the Sales & Unit Mix
Input the date you started selling the beer in column C
Input the date the batch was exhausted in column D
Enter the total equivalent pints sold in the taproom in column F
Enter average price received for an equivalent pint in the taproom in column G
Add the average pints per ticket in column H
Enter total barrels sold via distribution in column I
Input the average price per bbl sold via distribution in column J
Enter the average customer rating (between 1 and 10) in column L
(An equivalent pint is the total ounces sold divided by 16. Or…the total bbl sold divided by 248)
Step 3 – Review results (Tab: Performance Metrics)
Batch Overview tab
Compare the Total Cost per bbl for the experimental brews to the Brewery Batch Average benchmark
Sales & Unit Mix tab
Review the charts for Average Pints per Taproom Ticket, Average Customer Rating, and Total Equivalent Pints Sold per Day
Compare the Average Price per Equivalent Taproom Pint and the Average Price per Distribution bbl to the Brewery Batch Average benchmark
Performance Metrics tab
Review the chart for Total Revenue, Gross Profit, and Gross Margin
Compare the Total Revenue per bbl to the Brewery Batch Average benchmark