Mastering Follow-Up Ship Dates: Lock in Your Sales Velocity
When you’re tracking sales velocity, it’s important to know when the product has been used up. If your communication and relationships with distributors and retailers are strong, you can often get that information directly. Otherwise, the best indicator might just be the follow-up ship date. If they’re ordering more, it’s a safe bet they’re nearly out of what was sent previously.
Having this data, and a solid working relationship, improves your brand’s shelf stability and makes demand more predictable. That predictability helps everyone. It supports better reorder planning, keeps sales momentum strong, and avoids both overstocking and stockouts.
Why follow-up dates matter for your brewery
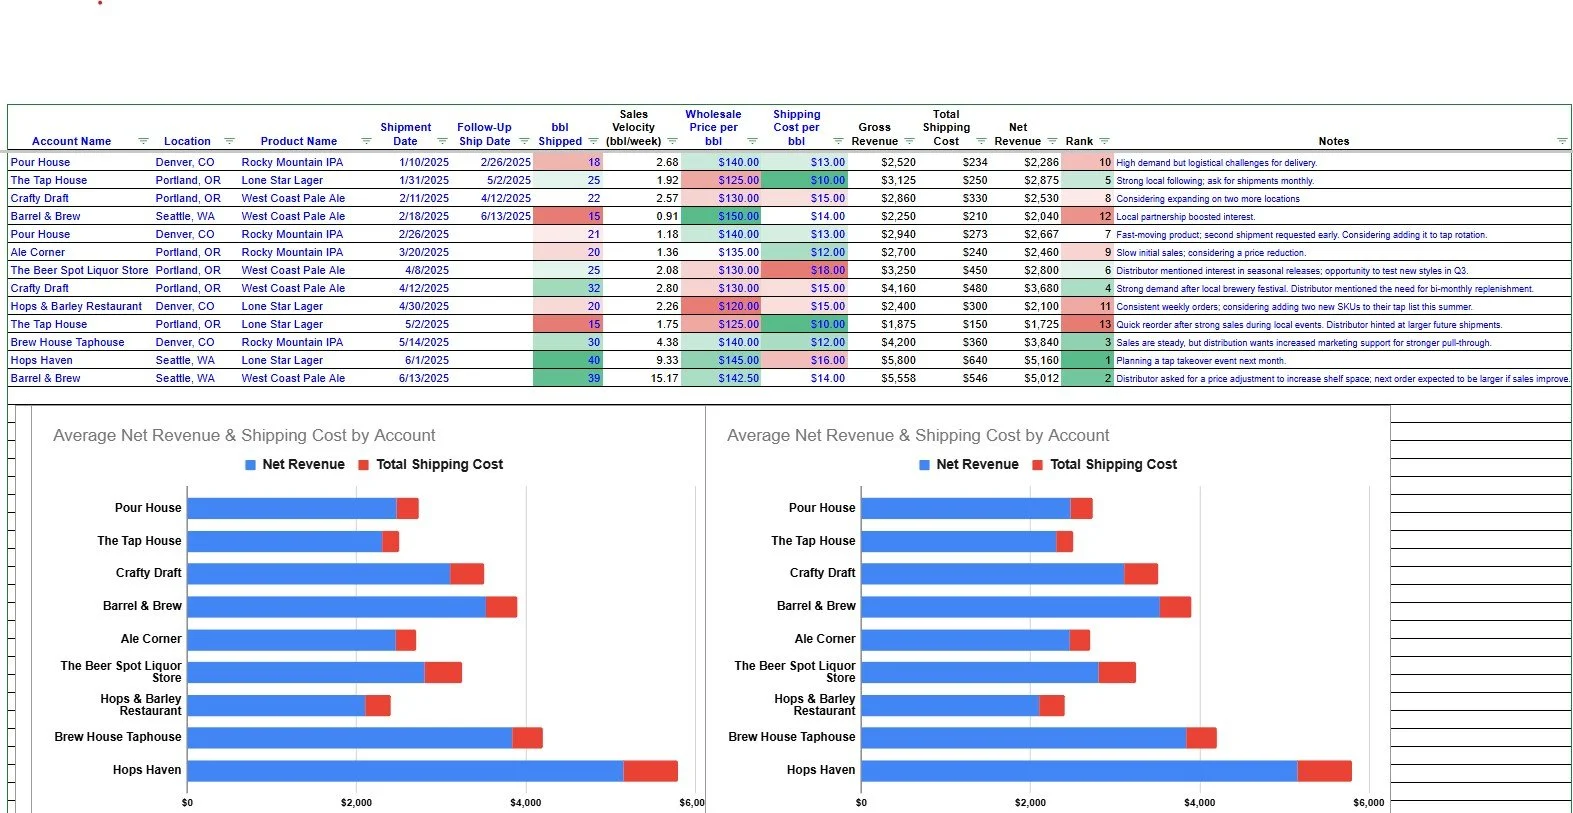
When you're tracking your sales velocity, timing matters. Time is the denominator in that equation. As time passes, the sales velocity number will naturally decline. That's why, in the Sales Velocity Tracker worksheet, putting a follow-up ship date is of utmost importance. The follow-up ship date is an estimate of when a particular account depleted its inventory of your product.
If you want to reflect back on the sales velocity performance of account/product combinations then you’re going to want that information. The date you shipped a new supply of that product is a good estimate if you don’t know exactly when they used up the old inventory. This will lock in the sales velocity number that you can use for analysis and forecasting going forward.
Without a follow-up ship date the sales velocity number is going to continue getting worse because the assumption is that this particular account still hasn't worked through that given product.
Work hand in hand with your distributors because they're going to have a solid understanding of how often inventory is turning for their customers. It impacts their decision on what the reorder and what gets more attention and more shelf space. Also what gets featured in seasonal rotations. A beer that reorders every 4 or 5 weeks is going to be more attractive than one that reorders every 10or so. Even if the total volume is the same.
Also, for your own analysis having accurate sales velocities will help you benchmark reorder cycles across products and accounts. It'll help you identify which beers or styles are consistently moving fast and turning over quickly. It also help you detect accounts that may need more support or a different product mix. Again, good information for you and your distributors
Hopefully your distributor is keeping track of the same information and sharing it with you. Nevertheless, it helps to do your own analysis for a “second set of eyes,” so to speak. Because it's in your best interest and in your distributor's best interest to have quickly moving inventory.
Maybe if you're just starting out in your brewery (or are on the smaller side) you might not be getting this sort of attention or information passed along to you. That's also a good reason to have it for yourself. If you can show your distributor that certain beers are turning over every 4 to 6 weeks you're going to put yourself in the front of the distributor's mind and build trust in your brand’s ability to move quickly. In turn, this will justify the distributor emphasizing your quality products to their customers. Hopefully resulting in increased placements in more beer on shelves and in taps. It also helps strengthen your negotiating position for promotions or better pricing.
That is the language of business and measuring this sort of data is extremely helpful for you to position your brewery as well as possible.
Calculating the ideal time for beer orders
Knowing when to follow up on a reorder is a key part of your wholesale strategy. Push too early and you risk overstocking your partners. Wait too long and your beer could run out, costing you shelf space and customer loyalty.
Ideally, your partners are tracking this too. But no one cares more about moving your beer than you do. If a customer can't find your beer, they’ll pick something else…and might not come back
If you can access inventory levels from your partners, here’s a simple formula:
Current Inventory ÷ Average Weekly Sales Velocity = Weeks of Supply Remaining
For example, if a distributor has 18 bbl left and you know they move about 3 bbl per week, that’s 6 weeks of supply. That gives you a rough timeline to coordinate reorders, production, and shipping.
There are two main approaches to timing reorders:
Time-based: Some accounts consistently reorder every 6 weeks, for example. That cycle may change due to seasonality. So monitoring velocity helps you adapt.
Velocity-based: This uses real-time sales data to estimate how long current inventory will last. It’s more flexible, especially if your beer is moving faster than expected.
Velocity-based reordering gives you a clearer picture. If sales spike, you can plan brewing accordingly. If things slow down, you can investigate. Maybe the account needs marketing help or a product switch.
If your distributor has 3 weeks of inventory remaining, that’s a trigger to check in. If the sales velocity dips below a certain threshold - say, 1.5 bbl per week - it’s another trigger to take action.
The Sales Velocity Tracker (linked above) lets you:
Input bbl shipped
Monitor elapsed time since shipment
Use follow-up dates to lock in velocity
Add custom columns for current inventory and weeks remaining if you have the data
With basic conditional formatting, you can quickly highlight best- and worst-performing combinations. Then, bring those insights into your monthly sales, production, or operations meetings.
Consistency drives profit
Ultimately, tools like the Sales Velocity Tracker help you drive consistency. Consistency makes forecasting easier, production smoother, and financial planning stronger.
You’ll never hit perfect consistency, but the closer you get, the better positioned you are across the board. Distributors and retailers trust brands that move predictably. Internally, you avoid brewing too much or running out unexpectedly.
A steady sales velocity tells the market your beer is in demand. It strengthens relationships, improves planning, and supports long-term profitability. It’s not just a KPI - it’s a leading indicator of your brand health.


